Accelerate grounded, better-informed decisions in urban contexts.
Redraw your city. Watch it respond.
CityCompass simulates every person, household, and developer in your region — and runs in your browser. Below is a real district: drag, paint and build on it.
Two decades of research and deployment: UC Berkeley → Synthicity (acquired by Autodesk) → UrbanSim → Urbanly. Land-use simulation behind 40+ regional agencies in the US, with deployments in Spain, New Zealand, Australia, Argentina and the USA.
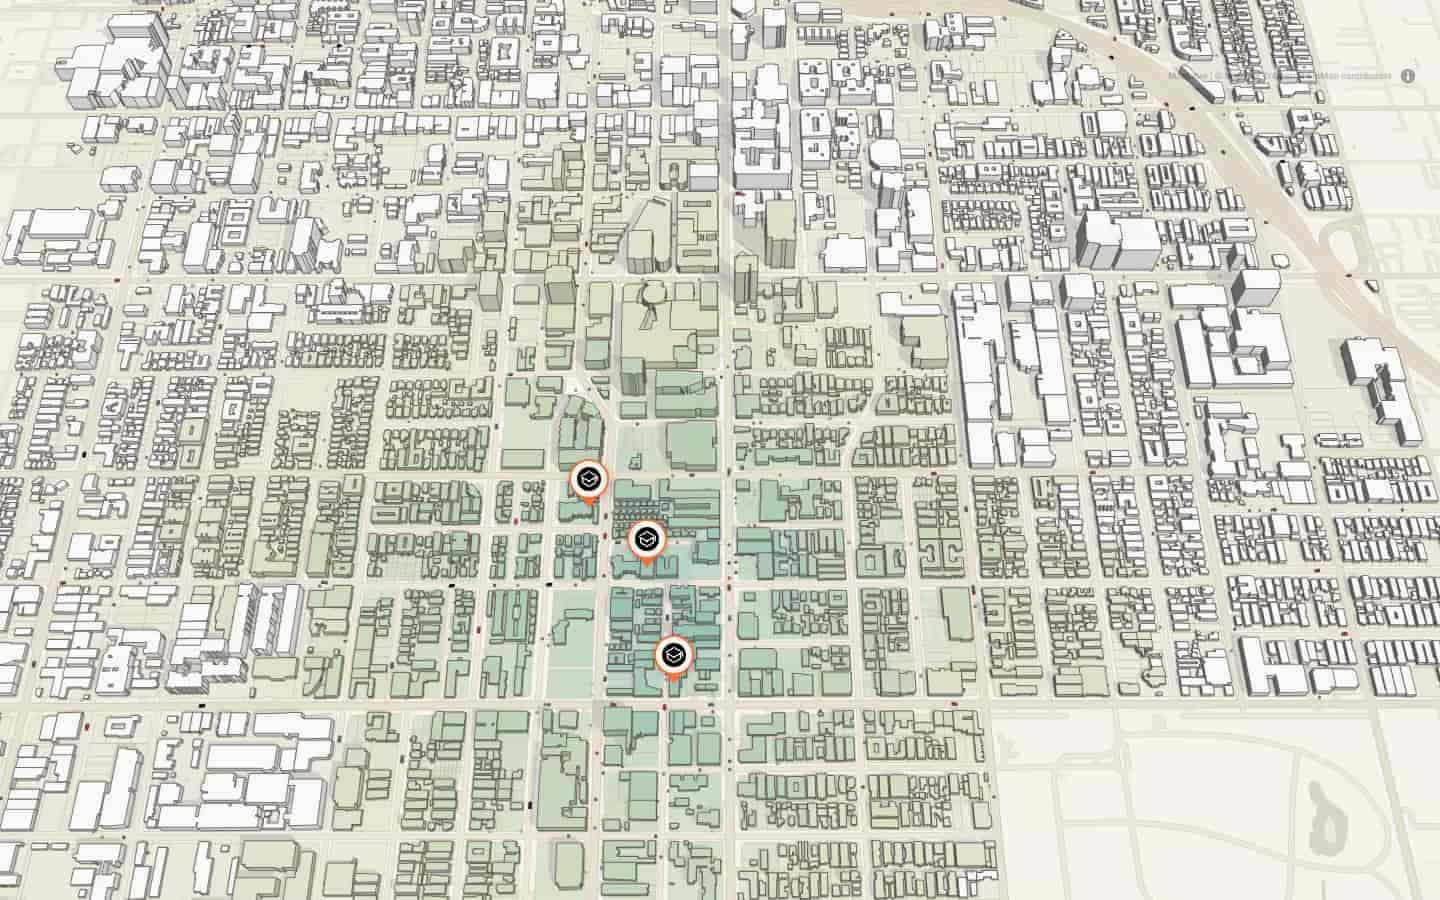
Who can reach what, on foot?
CityCompass scores access parcel by parcel from real travel times — move a school and the 10-minute map repaints as you watch. The same scoring sited social housing along 35 km of rail in Rio de Janeiro.
Does a new line change who can reach what?
Draw the line, drop the stops, and accessibility recomputes in near real time. In Luján de Cuyo, one transit-ready crossing grew the 15-minute catchment by 190%.
What does growth do to traffic?
Traffic runs on the same simulated households as the housing market — put jobs on the map and watch commutes load the streets. Growth and its consequence stop being two separate studies.
How many homes get built, and when?
Upzone a corridor or masterplan a site: developer agents run the numbers and build only what pencils out — a construction timeline, not a capacity guess.
Will these homes be livable in 2040?
Heat-island modeling with the cooling effect of trees and parks, scored against the 3-30-300 rule — so livability is simulated alongside the growth, not estimated after it.